 Admin
AdminKeymaster
December 31, 2020 at 8:34 am
Post count: 1622
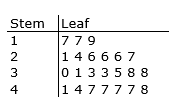 The following scores (out of 50) were achieved in a Spanish test in a class of 23 students. The results are set out below in a stem and leaf graph. The following scores (out of 50) were achieved in a Spanish test in a class of 23 students. The results are set out below in a stem and leaf graph.
a. Find the range.
b. Find the median.
c. Find the mean mark.
d. Find the standard deviation.
e. Find the upper quartile.
f. Find the mode. |
|
a. Range = 48 – 17
= 31
|
range = highest score – lowest score
the highest score is 48 (which is the 4 with the 8 at the end = 48)
the lowest score is 17 (which is the 1 with the 7 at the end = 17) |
| b. median = 33 |
median is the middle score: since there are 23 students, then we need to find half of 24 (23 + 1 – you always add one and then divide by 2 to find the halfway number)
so we are looking for half of 24 which is 12 – so count to the 12th score which will be the 3 in the 3 stem ie 33
17 17 19 21 24 26 26 26 27 30 31 | 33 | 33 35 38 38 41 44 47 47 47 47 48
|
|
c. mean = $$\frac{762}{23}$$
= 33.13
|
mean: add all the scores and divide by how many
total = 762
n = 23 |
| d. SD = 10.17 |
to find the SD, you will need to get into stats mode on the calculator and enter the data |
| e. Q3 = 44 |
the upper quartile of Q3 is the median of the upper half of the scores
Since the median was the first 33, then we consider the top half of the scores
17 17 19 21 24 26 26 26 27 30 31 33 consider just these numbers 33 35 38 38 41 44 47 47 47 47 48
or you can find the ¾(n + 1) score = ¾ × 24 = 18 – count to the 18th score = 44 |
| f. mode = 47 |
mode is the most frequently occurring score, which in this case is the 7’s in the 4 stem ie: 47 |

