Which of the diagrams below displays a set of scores which has its mode less than its mean?
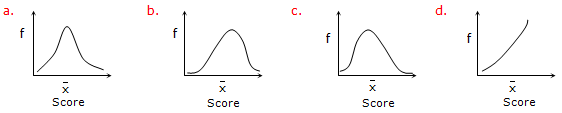
the mode is the highest point on the diagram
the mean is the $$\bar{x}$$
a has mode and mean equal
b has mean lower than mode that is to say mode is more to the right than the mean
c has mode lower than mean that is to say mode is more to the left than the mean
d has mean lower than mode that is to say mode is more to the right than the mean
∴ c

