 Admin
AdminKeymaster
December 31, 2020 at 8:36 am
Post count: 1622
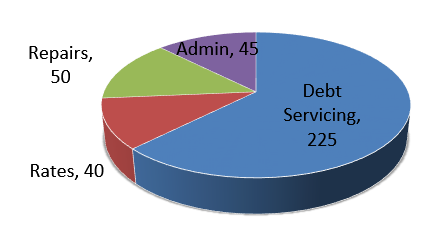 A local council released the details of its expenditure in the previous financial year by means of a sector graph as shown. The angle for the ‘Debt Servicing’ sector is 225°. If a total of $15 000 000 was spent on the four sectors, the amount spent on Debt Servicing was how much? A local council released the details of its expenditure in the previous financial year by means of a sector graph as shown. The angle for the ‘Debt Servicing’ sector is 225°. If a total of $15 000 000 was spent on the four sectors, the amount spent on Debt Servicing was how much? |
$$=\frac{225}{360}\times15000000$$
= $9,375,000 |
a sector graph adds up to 360°, so each section will be out of 360 Dept Servicing is 225 out of 360 as a fraction of 15,000,000 |

