Timetable › Forums › Standard › Statistics & Data › Outliers
Tagged: Data, Outliers, Statistics
Viewing 4 posts - 1 through 4 (of 4 total)
-
AuthorPosts
-
Outliers
An outlier is a score that is unusual, or different from the bulk of the scores. A score is an outlier if it is more than 1.5 times the IQR (interquartile range) below Q1 or more than 1.5 times the IRQ above Q3.
Q1 – 1.5 × IQR
Q3 + 1.5 × IQRA set of data has a lower quartile of 22 and an upper quartile of 27. Which of the following values could be an outlier?
a. 15 b. 22 c. 24.5 d. 29 e. 35
IQR = 27 – 22
= 5
lower limit = 22 – 1.5 × 5
= 14.5
upper limit = 22 + 1.5 × 5
= 29.5
E is outlier as it is higher than the upper limit of 29.5
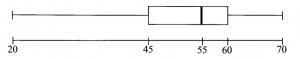 Joe created a box and whisker plot from collected data. He claimed that the lowest score must be an outlier. Is he correct? Justify your answer with appropriate calculations.
IQR = Q3 – Q1
= 60 – 45
= 15Find the IQR (interquartile range)
IQR = Q3 – Q1
20 is the minimum
45 is Q1
55 is the median
60 is Q3
70 is the maximum45 – 1.5 × 15
= 22.5test if outlier using formula Q1 – 1.5 × IQR since the lowest score is 20, which is below the cut off point of 22.5, then yes, the lowest score is considered to be an outlier, so Joe is correct any score lower than this is considered an outlier Seeds were planted in a controlled environment. The heights of the resulting plants were recorded some weeks later. The data collected was found to have an interquartile range of 12cm with a lower quartile of 22cm. Which of the following plant heights would be considered an outlier of the data collected?
a. 3cm
b. 4cm
c. 35cm
d. 50cm22 – 1.5 × 12
= 4IQR = 12cm
Q1 = 22cm
test if outlier using formula Q1 – 1.5 × IQR∴ A any score lower than 4 is an outlier -
AuthorPosts
Viewing 4 posts - 1 through 4 (of 4 total)
- You must be logged in to reply to this topic.

