Timetable › Forums › Standard › Statistics & Data › Radar Charts
Tagged: Radar Charts, Statistics
-
AuthorPosts
-
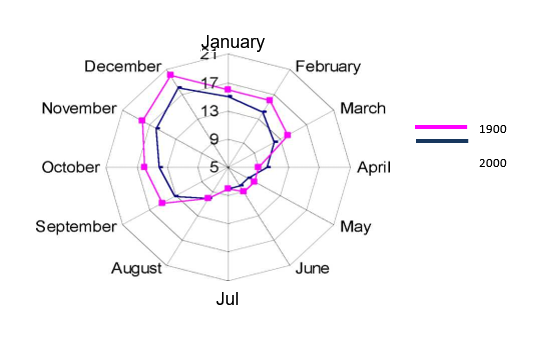
The chart below shows the average minimum temperature for the years 1900 and 2000.
What was the difference in the minimum average temperature between 1900 and 2000 for January?
a. 1900 was 1 degree hotter.
b. 2000 was 1 degree hotter.
c. 1900 was 2 degrees hotter.
d. 2000 was 2 degrees hotter.January 1900 = 16
January 2000 = 15Option A, 1900 was one degree hotter
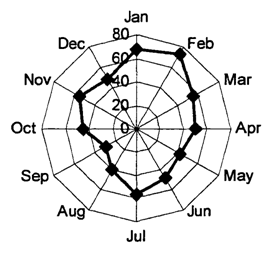 The radar chart was constructed from data collected during the year 2004. The information relates to the average monthly rainfall, measured in mm, received in a NSW country town.
a. Which month had the highest average monthly rainfall?
b. Approximately what was the average monthly rainfall in October?
c. Briefly describe the rainfall pattern for this country town during 2004.a. February to find the maximum, we need to locate the month that is closest to the outer edge of the radar graph, which will be Feb – which is approximately 75 b. 45mm the rainfall for October is between the 40 and 60 lines, a little closer to 40 than 60, so a good estimate would be about 45mm, as it is less than halfway c. The heaviest rainfall occur in the Summer months , and then is fairly steady for the rest of the year, with the lowest rainfall in September write a description based on the information in the graph. Use the marking scale as a guideline. If it is worth more than one mark, be sure to make more than one comment 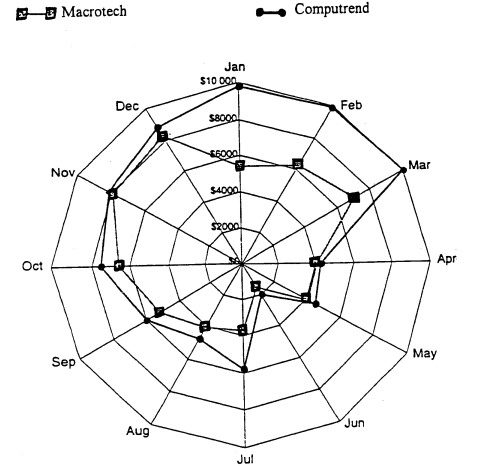 The Radar chart, shows the comparison between the profit made in sales of computer software by two different companies over the previous 12 months.
a. What profit did Computrend make in September?
b. In which month was the difference in profit between the two companies the greatest?
c. In which period of two consecutive months during the year, did Macrotech suffer the greatest decline in profit?
d. Suggest a reason why the profits of both companies was significantly less in June than in other months.
e. What was the percentage increase in profit made by Computrend from August to September?a. $6000 Computrend is the one with the small solid blocks and in September it made $6000 b. January the difference will be the greatest when the gap between the two lines is the greatest – which is in January as Computrend is just under $6000 and Macrotech is just under $10,000 c. December – January Macrotech’s two greatest losses were from Dec-Jan and May-Jun, but the Dec-Jan one is slightly more d. End of Financial Year Sales in June, would likely mean purchases were made because of the Sales and Tax Benefits, so funds would be low and new software not required as it was already purchased in this case, the beginning of the financial year is the most likely. Companies tend to spend up big in end of financial year sales in June, where things are cheaper and they can get tax benefits, and since they have spent all their money and bought computer software in June, they wouldn’t need any in July e. $$=\frac{1000}{5000}\times 100$$
= 20%
August = $5000 and September = $6000, so profit was $1000. to find the percent increase, put the increase over the original and times by 100 -
AuthorPosts
- You must be logged in to reply to this topic.

