Timetable › Forums › Standard › Statistics & Data › Box and Whisker
Tagged: box and whisker plots, Standard, Statistics
-
AuthorPosts
-
Box and Whisker Plots
The box and whisker plot is made up of two ‘whiskers’ and a box.
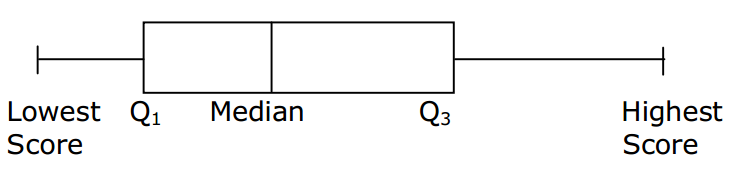
Lowest score: the lowest score in the data set Q1: the lower quartile, which cuts off the bottom 25% of the scores Median: the middle of the scores, which cuts off the middle 50% of the scores Q3: the upper quartile, which cuts off the top 25% of the scores Highest score: the highest score in the data set.
IQR
The IQR (inter quartile range) represents the middle 50% of the scores. IQR = Q3 – Q1
Outlier
An outlier is a score that is unusual, or different from the bulk of the scores. A score is an outlier if it is more than 1.5 times the IQR (interquartile range) below Q1 or more than 1.5 times the IRQ above Q3.
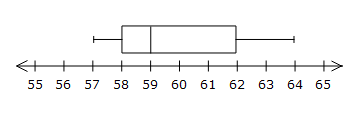 The box-and-whisker plot represents the performance of a class in a recent geography test. What is the percentage of students who scored more than 62?
since 62 is Q3, then 75% scored below 62, hence 25% scored higher than 62
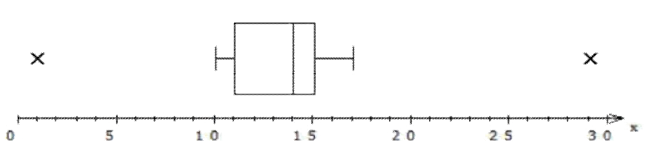
Find the median, the interquartile range and draw a box and whisker plot.
Data set: 1, 10, 11, 11, 11, 13, 13, 14, 14, 14, 15, 15, 15, 17, 17, 29
To find the median we need to find the middle score: 1, 10, 11, 11, 11, 13, 13, 13,|14, 14, 15, 15, 15, 17, 17, 29
The median will be halfway between 13 and 14 = 13.5To find the lower quartile (Q1) and upper quartile (Q3) we find the ‘median’ of each group.
Q1: 1, 10, 11, 11,| 11, 13, 13, 13 Q3: 14, 14, 15, 15,|15, 17, 17, 29 Q1 = 11 Q3 = 15 ∴ IQR = 15 – 11 = 4 Check for outliers:
1.5 × IQR = 1.5 × 4 = 6Q1 – 6 = 11 – 6 = 5 Q3 + 6 = 15 + 6 = 21 so any score under 5 is an outlier
1 is the only score under 5, ∴ 1 is an outlier
so any score above 21 is an outlier
29 is the only score above 21, ∴ 29 is an outlier
-
AuthorPosts
- You must be logged in to reply to this topic.

