Timetable › Forums › Standard › Statistics & Data › Mean, Median, Mode, Range, Quartiles
Tagged: Central Tendency, Data, Interquartile Range, mean, Median, mode, quartiles, Range, Statistics
-
AuthorPosts
-
Measures of Central Tendency
Range
Highest Score – Lowest Score
Mean
$$\bar{x}=\frac{\text{sum of scores}}{\text{number of scores}}$$
$$\bar{x}$$= average
Mode
Most frequently occurring score
Median
Middle Score $$Median=\frac{1}{2}(n+1)$$ score
add 1 to the number of scores and then divide by 2, this will tell you what number score you are looking for
Q1
$$Q_1=\frac{1}{4}(n+1)$$ score
Q3
$$Q_3=\frac{3}{4}(n+1)$$ score
Interquartile Range
$$IQR=Q_3-Q_1$$
measures the spread of the middle 50% of the scores
Outliers
Q1 – 1.5 × IQR
Q3 + 1.5 × IQRThe scores 3, 5, 6, 7, 8, 5, 3, 5 have a mean 5.26 and standard deviation 1.64. How many of these scores are more than 1 standard deviation from the mean?
lower limit 5.26 – 1.64 = 3.62
upper limit 5.26 + 1.64 = 6.9
so you just count the scores under 3.62 and more than: 6.9 3, 7, 8, 3
∴ 4 scoresJose managed to save the following amounts over the 8 weeks before he went to the Gold Coast for schoolies’ week: $30, $32, $50, $45, $35, $55, $56 $40, $300. Which measure of central location would it better to use if we wanted to give an indication of the typical amount saved by Jose each week?
a. mode b. median c. mean d. sdmode: there is no mode, so that is no help consider each case median: is the middle score: 45 30 32 35 404550 55 56 300mean: because the 300 is an outlier, the mean becomes unreliable if there is a number that is very different from the majority of the other numbers, it will have a dramatic affect on mean, range and standard deviation, which will make them a more unreliable measure sd measures spread sd is of no interest in anything other than spread or consistency – larger sd the more spread out from the average scores are, the smaller the sd, the closer to the average they are ∴ median is the best measure Find the median
Number of hours
0 to 4
5 to 9
10 to 14
15 to 19
20 to 24Class Centre
2
7
12
17
22Frequency
5
8
3
2
1Number of hours
0 to 4
5 to 9
10 to 14
15 to 19
20 to 24
Class Centre
2
7
12
17
22Frequency
5
8
3
2
1Cum Freq
5
13
16
18
19Add a cumulative frequency column taking the first frequency which is 5
then there are 8 more to add: 5 + 8 = 13
then 3 more to add: 13 + 3 = 16
then 2 more to add: 16 + 2 = 18
then 1 more to add: 18 + 1 = 19Number of hours
Class Centre
Frequency Cum Freq Score Number 0 to 4 2 5 5 1 – 5 5 to 9 7 8 13 6-13 10 to 14 12 3 16 14 – 16 15 to 19 17 2 18 17 – 18 20 to 24 22 1 19 19 now, there are 19 scores, to find the middle we add 1 to 19 and then halve it.
Half of 20 is 10, so we are looking for score number 10.
Add a new column for numbering the scores
for the first it will be score numbers 1 through to 5, so the second one will start at 6 and go through to 13, the next starting at 14 and going through to 16, then 17 and 18 and the last one 19We are interested in score number 10, which is in between 6 – 13 section, so the median class would be that one, ie: 5 – 9median class is 5 – 9
For the following set of scores find the median: 1, 8, 7, 4, 8, 8, 7, 12, 3, 2, 6 1 2 3 4 6 7 7 8 8 8 12 step 1 is to arrange the scores in order from lowest to highest 1 2 3 4 6 7 7 8 8 8 12
median = 7
there are 11 scores : ½ × (11+ 1) = 6
we are looking for score number 6 (not the actual score 6 but which score is in the 6th position) which will be 7 which puts it in the middle with 5 scores on either sideFind the median of the following data set: 12, 3, 14, 7, 8, 20 3 7 8 12 14 20 step 1 is to arrange the scores in order from lowest to highest 3 7 8 | 12 14 20 there are 7 scores : ½ × (6+ 1) = 3.5
we are looking for score number 3.5 (not the actual score 3.5 but which score is in the 3.5th position) which will be between score number 3 and score number 4, which puts it in the middle with 3 scores on either sidehalfway between 8 and 12 = $$\frac{8+12}{2}$$
median = 10
now we need to find what is halfway between 8 and 12  Find the median for the following dot plot.
score number = ½(17 + 1)
= 9thcount the dots: there are 17 scores (dots) median = 17 we are looking for the 9th score
start counting the dots from the lowest score until number 9
numbers 1 and 2 will be in 12, 3 and 4 will be in 14, 5,6 and 7 will be in 15, 8,9 and 10 will be in 17 and since we want number 8 then 17 will be medianThe prices of 5 cars sold by a used car yard were: $5700, $11000, $13000, $7590, $6000. Find the median price. $5700 $6000 $7590 $11000 $13000 first job is to put them in order of smallest to largest $5700 $6000$7590$11000$13000find the number that is in the middle, which in this case is $7590
easiest way is to start and cross off one from front, one from end until you arrive at the middle number (or middle two numbers)∴ median is $7590
What is the mean amount of time spent on homework? 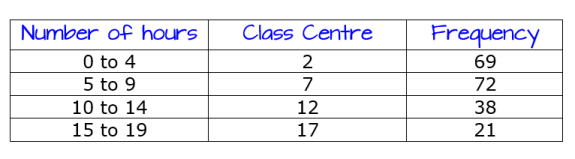
1455 ÷ 200
$$\overline x $$= 7.275
∴ mean = 7.275
mean is the average – the total of all the scores divided by how many scores
Add an fx column by multiplying the Class Centre by the Frequency
Find the sum of the Frequency and FX columns ∑ is the symbol for sum
the sum of the FX column divided by the sum of the F column
$$\overline x $$ (x bar) is the average/mean
-
AuthorPosts
- You must be logged in to reply to this topic.

